Facebook
RSS

BIRT for Maximo


Business Intelligence and Reporting Tools
(BIRT) is a top level project within the Eclipse Foundation, an independent not-for-profit consortium of software industry vendors and an open source community.
Strategic members include Actuate, IBM, Oracle and SAP. Actuate is one of the largest dedicated reporting software companies in the world and is the primary sponsor of the BIRT project.

The Resonate two day BIRT for Maximo dedicated training course can be delivered worldwide in your own premises or in classroom facilities. The course comes complete with a full set of training notes containing step by step guides and exercises.

BIRT Software is free of charge and carries no support cost burden as it is supported by the community. Over 7 million copies have been downloaded since it's launch in 2005 so that community is very large indeed. However unlike most open source systems, commercial support is also available from Actuate for business critical implementations. There are no time or functionality limitations and having been used by so many people the software is robust and highly extensible.

BIRT does not require an expensive data warehouse and will work directly over your existing applications, within your existing infrastructure, meaning that implementation is fast and inexpensive and your report information is always completely up to date. BIRT reports are entirely web based so there is no client software to install and no matter how geographically diverse your organization, your business information is available to security cleared operators anywhere on the planet, all that is needed is an internet connection. BIRT delivers highly graphical reports with many graph formats out of the box, supports multiple listing formats, including "side by side", has full sub-report / drill down functionality and can output results to HTML, Excel, PDF and more.
[ Read More ]

Preventive Maintenance Forecasting

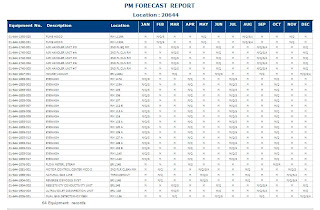
Planning & Scheduling is an important function of any EAM team. There are several other tasks which depend on planning & scheduling. Managers are interested in knowing how many work orders are generated in a year’s time. Workorders are categorized as either planned or unplanned workorders. Planned workorders are forecasted using a BIRT report Preventive Maintenance Forecasting.


Annual PM Forecasting report shows yearly PM’s for locations and assets. If we pass a location as a parameter it will show assets attached with all the children locations and yearly preventive maintenance plan for each asset and location. It is also possible to estimate labor hrs & cost , material cost and tool cost for these PM’s .Using color codes in this report we can show PM’s which were generated in the past , PM’s which are due and forecasted PM’s .
[ Read More ]

Sample report for managing Maximo workorders using BIRT Reports


Report Description : This report shows the count of workorders by worktype and workstatus for different levels of plant.
[ Read More ]

How to manage Maximo workorders using BIRT Reports


There are thousands of workorders generated in IBM Maximo. Workorder follows a life cycle and during this cycle workorder passes through different departments like planning, scheduling, Inventory, maintenance craft and owners of the workorder. The departmental jobs on workorders are interdependent, Example: unless and until planning is done scheduler cannot schedule it or a technician cannot execute it .It is essential to monitor performance of all activities at all levels related to workorder to ensure its smooth execution.
Using BIRT reports it is possible to develop a solution for workorder management. This solution involves several steps. The first step is to identify parent locations in a site and different work types. The second step is to define KPI’s for different locations and a work type for e.g. safety PM a set of KPI’s will be scheduled for period ,backlog before, backlog completed, complete to schedule , overdue < 29 days , overdue 30 to 59 days , overdue 60 to 89 days and overdue 90 + days and cancelled workorders . All these KPI’s for a particular work type are summarized using crosstab or graphs for multiple locations. This will help to compare performance of different locations.
This is a drilldown report. The third step is if a particular location has highest backlog or more overdue workorders then to investigate this,one can further drilldown and see the workorders by department , shift or owner group . The fourth step is to drill down to workorder list and the last step is from workorder list report go to workorder details report.
This will help organizations to monitor trend of workorders generated daily weekly, or monthly hencereduce workorder backlog and improve workorder compliance.

[ Read More ]

    Blogroll