Facebook
RSS

Preventive Maintenance Forecasting

Planning & Scheduling is an important function of any EAM team. There are several other tasks which depend on planning & scheduling. Managers are interested in knowing how many work orders are generated in a year’s time. Workorders are categorized as either planned or unplanned workorders. Planned workorders are forecasted using a BIRT report Preventive Maintenance Forecasting.


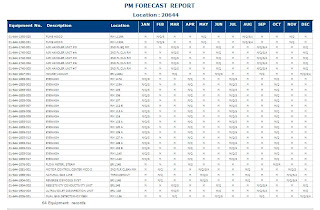
Annual PM Forecasting report shows yearly PM’s for locations and assets. If we pass a location as a parameter it will show assets attached with all the children locations and yearly preventive maintenance plan for each asset and location. It is also possible to estimate labor hrs & cost , material cost and tool cost for these PM’s .Using color codes in this report we can show PM’s which were generated in the past , PM’s which are due and forecasted PM’s .
[ Read More ]

Sample report for managing Maximo workorders using BIRT Reports


Report Description : This report shows the count of workorders by worktype and workstatus for different levels of plant.
[ Read More ]

How to manage Maximo workorders using BIRT Reports


There are thousands of workorders generated in IBM Maximo. Workorder follows a life cycle and during this cycle workorder passes through different departments like planning, scheduling, Inventory, maintenance craft and owners of the workorder. The departmental jobs on workorders are interdependent, Example: unless and until planning is done scheduler cannot schedule it or a technician cannot execute it .It is essential to monitor performance of all activities at all levels related to workorder to ensure its smooth execution.
Using BIRT reports it is possible to develop a solution for workorder management. This solution involves several steps. The first step is to identify parent locations in a site and different work types. The second step is to define KPI’s for different locations and a work type for e.g. safety PM a set of KPI’s will be scheduled for period ,backlog before, backlog completed, complete to schedule , overdue < 29 days , overdue 30 to 59 days , overdue 60 to 89 days and overdue 90 + days and cancelled workorders . All these KPI’s for a particular work type are summarized using crosstab or graphs for multiple locations. This will help to compare performance of different locations.
This is a drilldown report. The third step is if a particular location has highest backlog or more overdue workorders then to investigate this,one can further drilldown and see the workorders by department , shift or owner group . The fourth step is to drill down to workorder list and the last step is from workorder list report go to workorder details report.
This will help organizations to monitor trend of workorders generated daily weekly, or monthly hencereduce workorder backlog and improve workorder compliance.

[ Read More ]

    Blogroll